Data Analysis of My Art Business
Simon Bland: 21 Jan 2025
An Overview
This analysis of my portrait and art business was done largely as an exercise, but it ended up generating some interesting insights. It uses my own data, collected over a period of 21 years to show what kinds of challenges I met while painting.
In this first article, I focus on an exploratory data analysis and visualization. It's an attempt to understand my art business at a high level without getting into too much detail. In the second article, I go into more depth and do some regression analysis.
Some details and links to the actual analysis have been provided in the footnotes section at the bottom of this article.
What is the Distribution of my Prices?
Like most artists, I spent a lot of time worrying about my prices and whether a few dollars more here or there would cause sales to dry up.
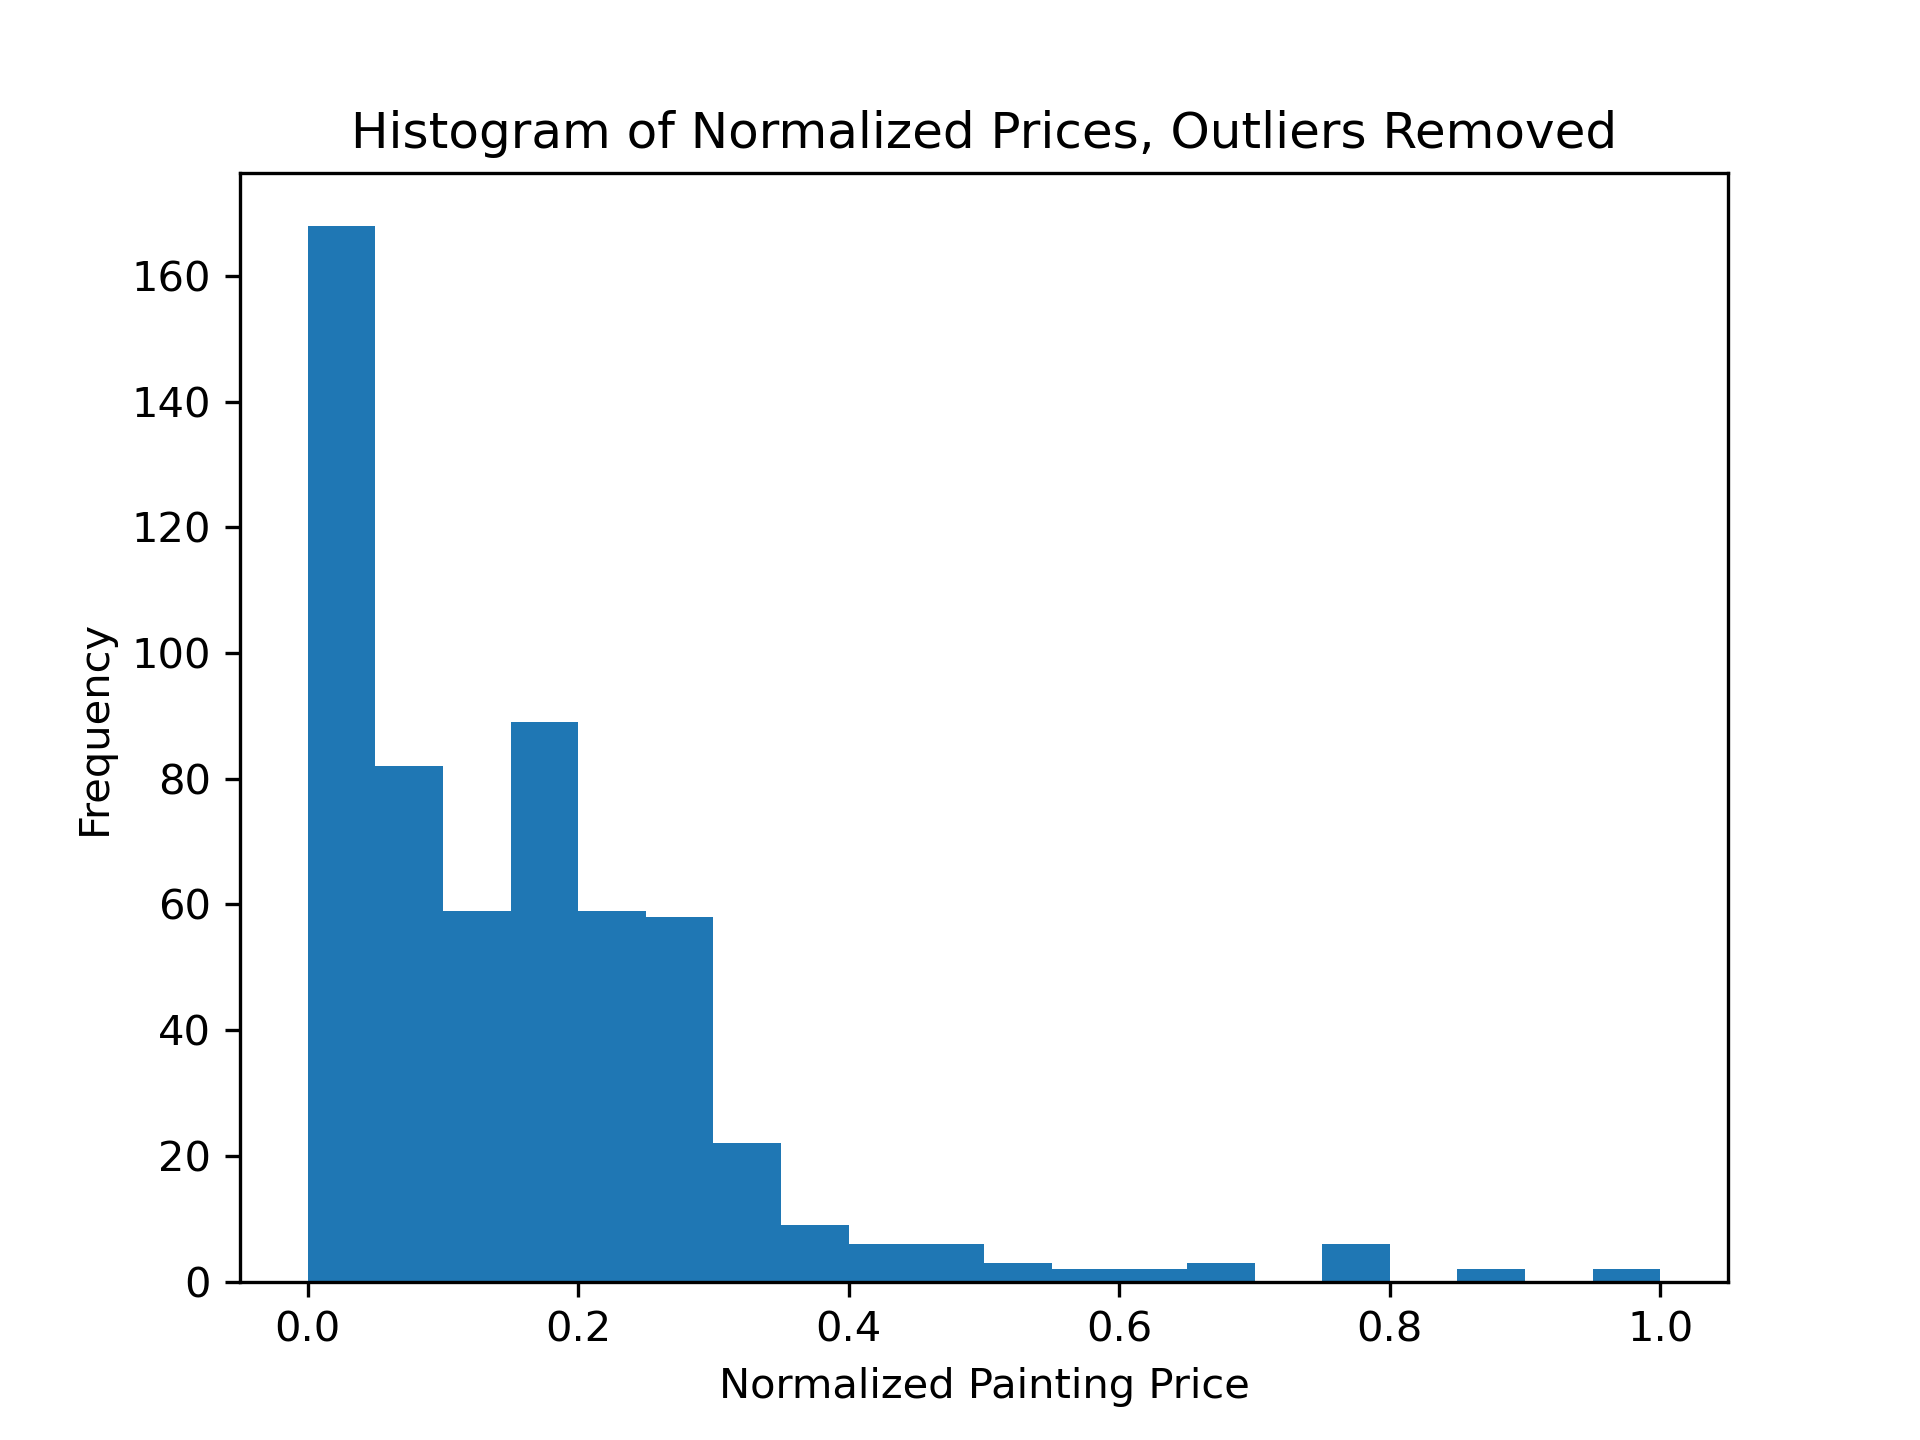
The histogram shows that most of my sales are of paintings in the bottom third of the range. I've plotted max/min normalized price here. That means the value of each sale has been adjusted so that it's on a scale of 0 (the smallest transaction price) to 1 (the largest transaction price).
What Kinds of Paintings Make Up Sales?
I split my paintings up into two main categories: commissioned paintings and retail artwork. Customers don't tend to buy only one type of art. The third category of "Other" covers things like book sales, licensing and restorations.
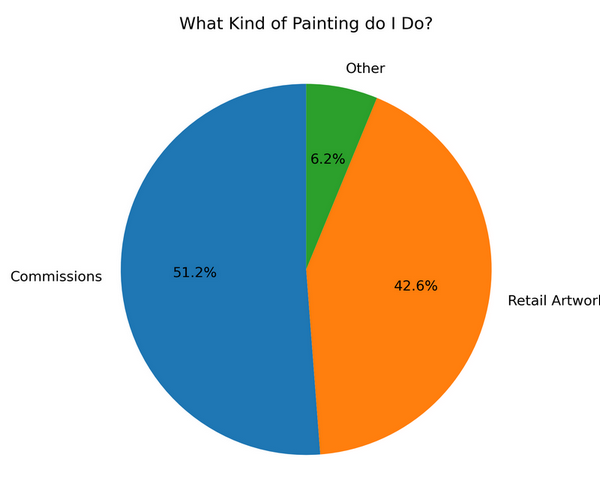
The pie chart shows the relative volumes of individual sales transactions. I had to pinch myself when I saw this, because I'd almost forgotten how many portraits were completed in the first 10 years.
What Kinds of Portraits Have I Painted?
A breakout of the commissions by type shows that I spent a large part of my early career focused on painting dogs.

The category 'Other' is doing a lot of heavy lifting here. It includes mixed portraits (e.g. people with their animals, boats, houses, and other types of landscapes.
What Are the Most Popular Dog Names Among My Clients?
Since I have painted so many dogs, it's possible to create a meaningful word cloud of the dogs' names so you can see what names are popular (among the cross-section of the population that commissions dog portraits, at least).

Bailey, Zeke, Molly, Emma, Max and Buddy get a cookie! Sorry about 'Unknown' there on the bottom left—I've occasionally been asked to paint dogs where a name wasn't provided.
How Has my Work Changed Over Time?
Like with most artists, my painting business has evolved. I started out painting portraits almost exclusively, then transitioned to put a greater focus on retail artwork. Since 2013 most of my sales have been made at art fairs and shows.
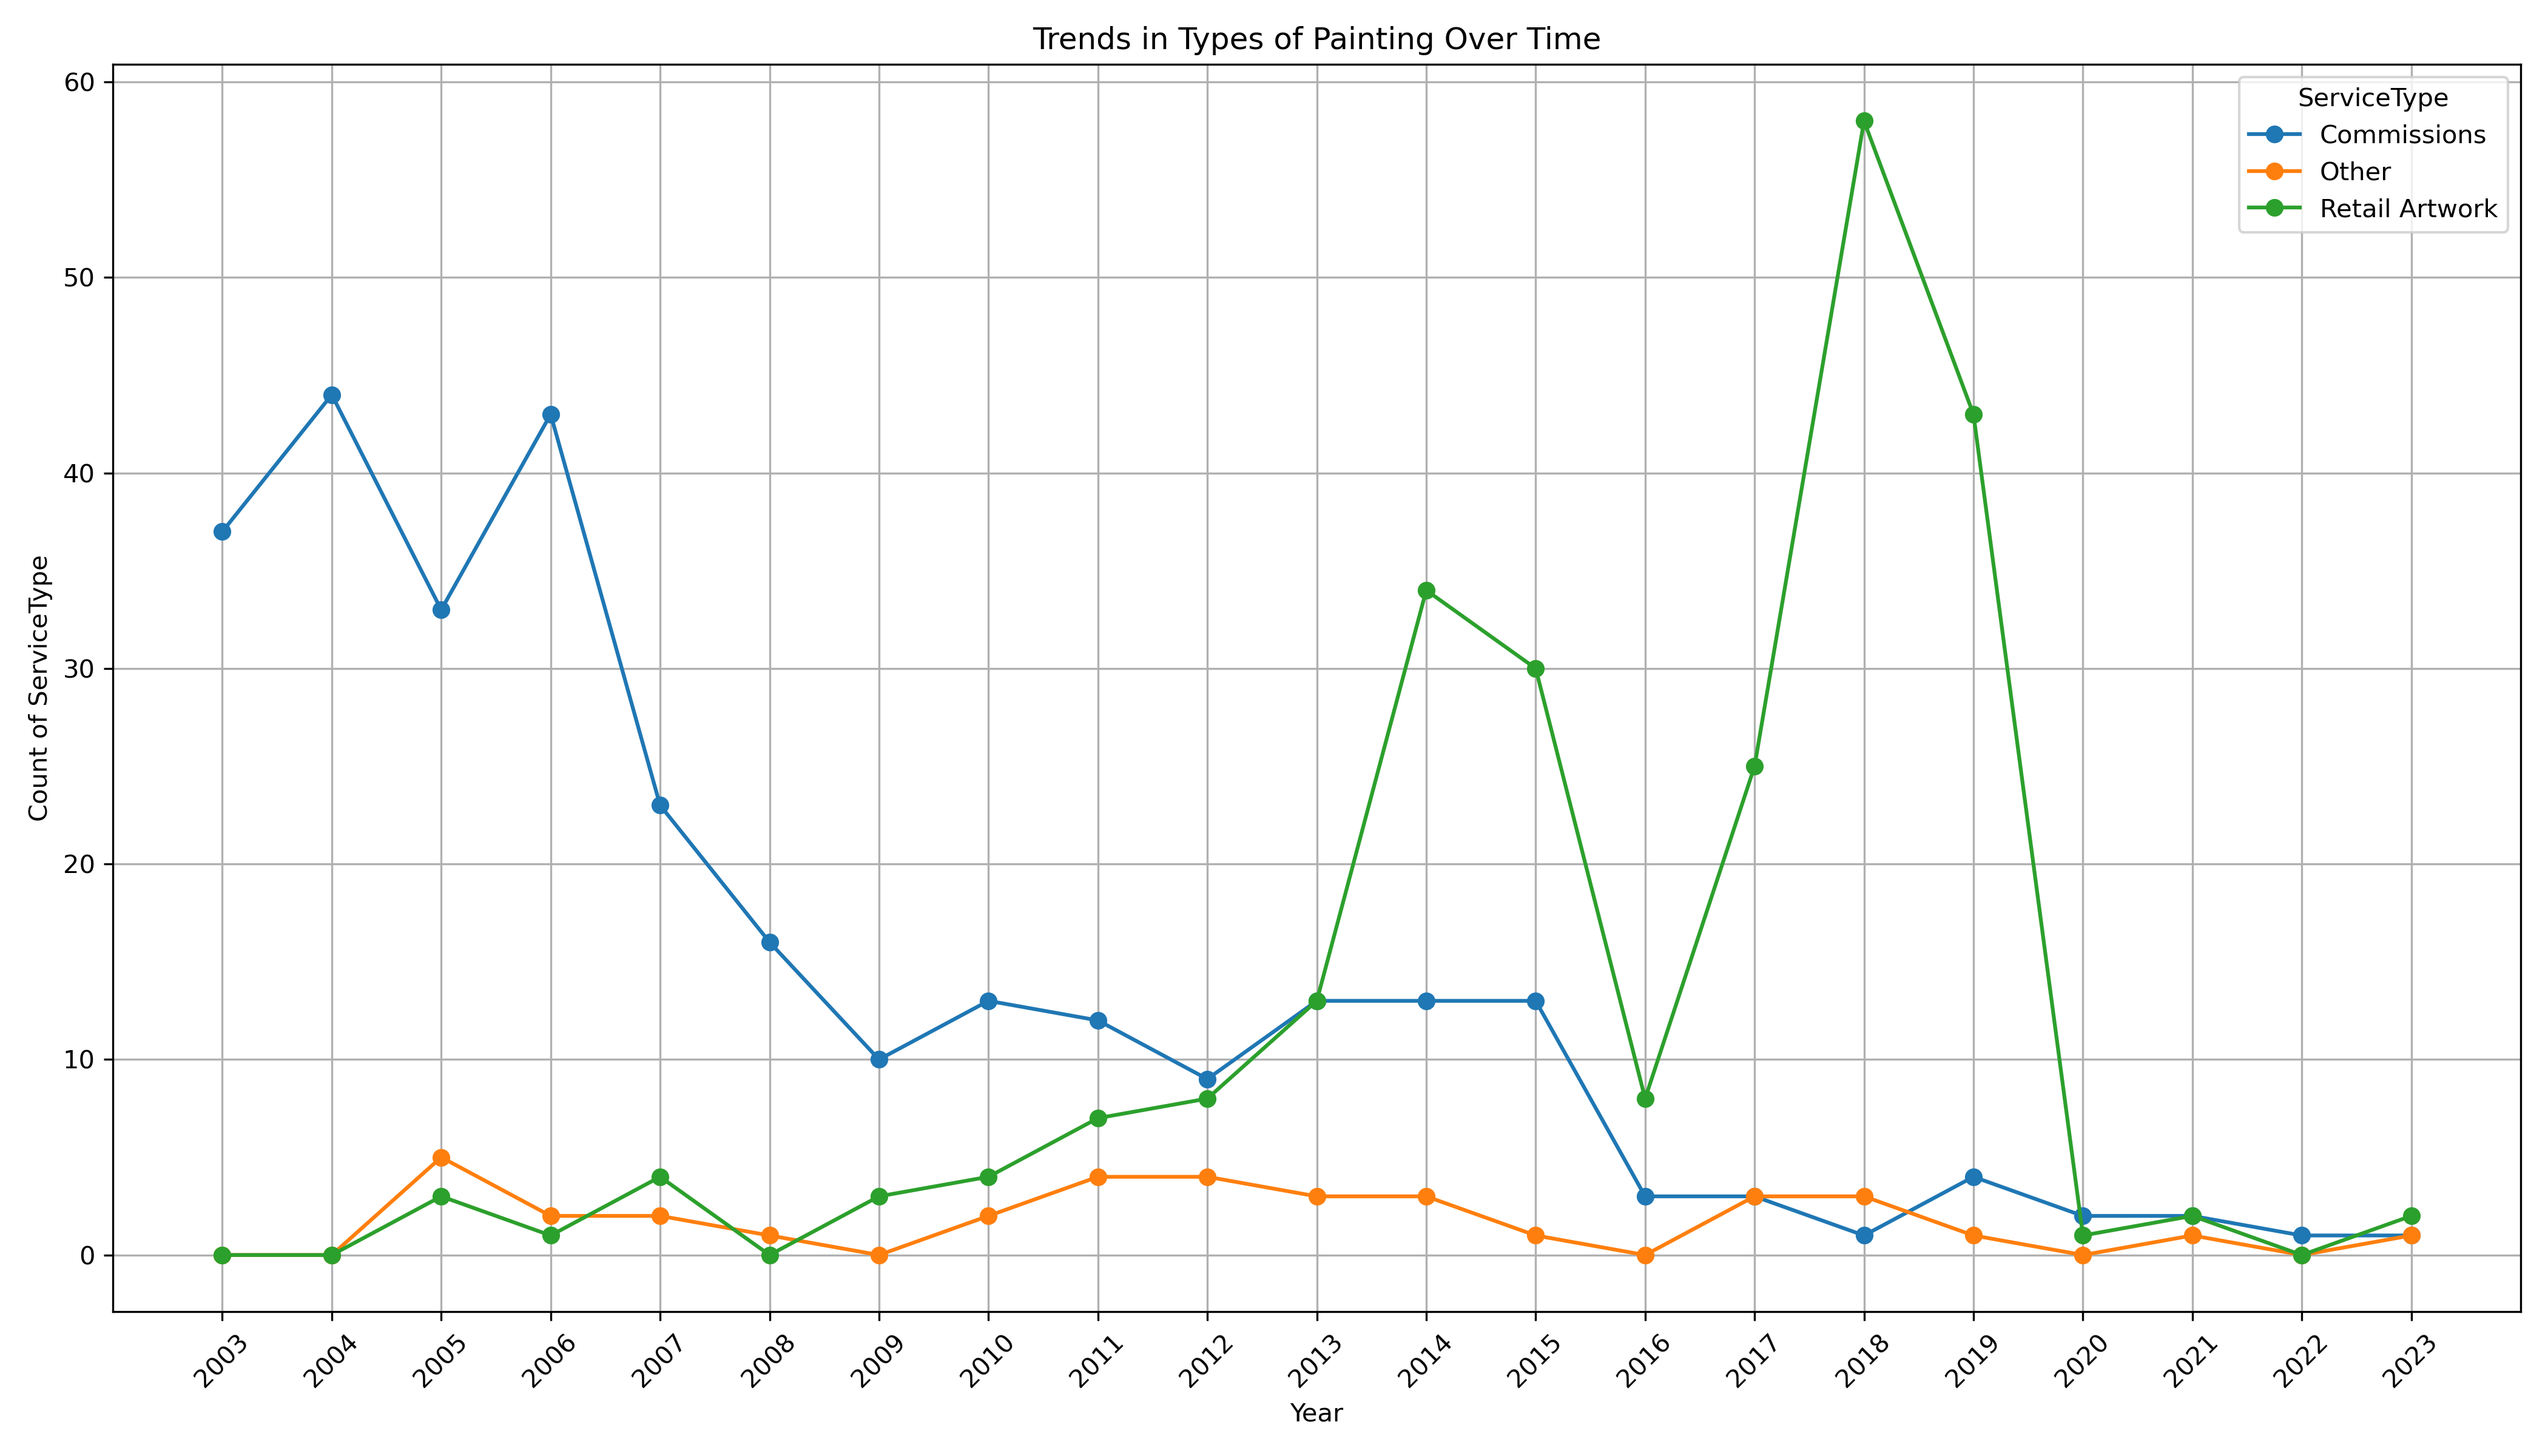
Changes in the type of painting I've done over time
What Events Have Affected Sales?
To understand dips in sales, you have to look at them in the context of events that occurred in the world in general and my life in particular. The world of fine art is very dependent on external economic factors and personal circumstances.
Here's how my revenues varied over time and a brief explanation for each change.

Obviously, the 2008 recession and a cross-country move from Virginia to Seattle had a tremendous impact. I had to rebuild my customer base twice over. My wife's cancer diagnosis in late 2019, combined with the COVID outbreak and another cross-country move from Seattle to Boston made it almost impossible to continue as a viable business, at least for the foreseeable future.
What Does Repeat Business Contribute to Sales?
I've always known that repeat sales are important. That's especially true for commissioned portraits, mainly because they are so difficult to market, and the sales volume is relatively low. Over 1/3 of my commissioned portraits are done as repeat business.
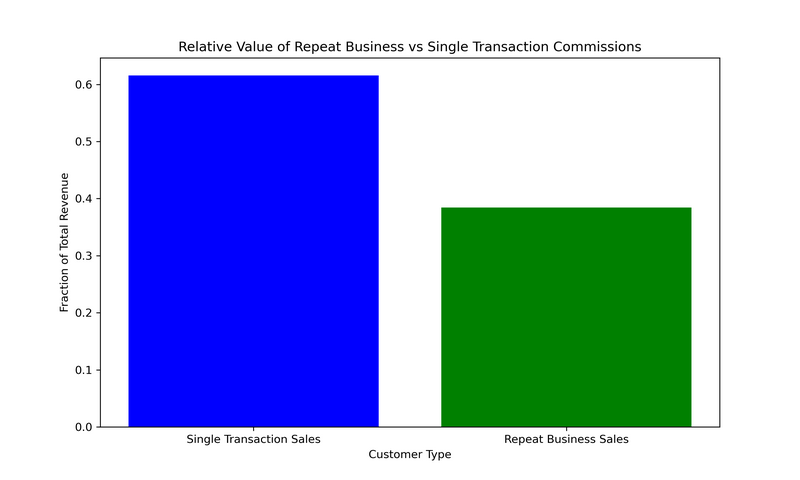
The percentage of repeat sales is much higher for retail art (yet another surprise) and it reinforces the idea that artists often refer customers like these as 'collectors'. Just under 50% of those sales are made to a repeat customer.
How Long Does It Take to Generate Repeat Business?
It's interesting to examine the timing of these second sales. 
Most repeat commissioned portrait sales occur in the 12 months immediately following the first portrait sale. This actually makes sense—a large piece of your one-on-one time with a customer comes when you deliver a portrait. Seeing a spike in repeat business in that first 5 months following a sale coincides with the timeframe in which the first portrait usually gets delivered.
When I look at the same plot for retail artwork sales, the distribution is less smooth and there are noticeable gaps in the distribution.
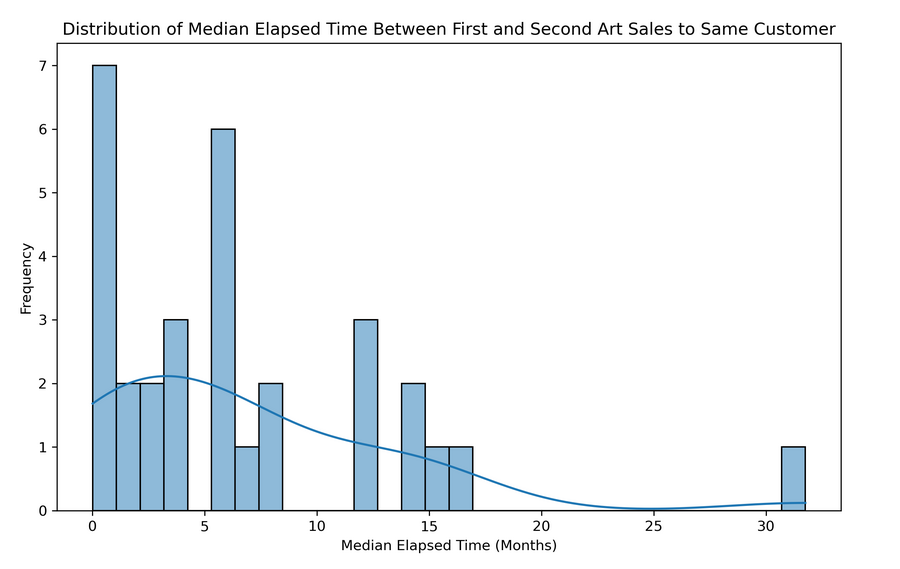
The reason for this is that I sell this kind of artwork at art fairs and shows. These events occur on a fairly rigid schedule, so you see noticeable spikes at 6 months and 12 months. The way the schedules work out, there are never any 5-month or 9-11-month intervals between shows
In multi-day events, some customers even come back on the next day. By the way, these last two plots just show the elapsed time between first and second sales, so if a customer buys yet another piece of work at a later date it's not shown here.
Footnotes
Privacy
Wherever possible, the data has been anonymized, and all financial data has been normalized. It doesn't make any difference to the value of the analysis, and it helps to maintain privacy.
Where is the Data From?
As soon as I started doing art full time, I built an application to help me manage my customer base, do invoicing and track expenses. With a few tweaks, that system has been in continual use for 20 years. The data was extracted from there via SQL queries and saved to a CSV file.
How Did I Clean and Analyze the Data?
You can see the full analysis I did in two parts on my GitHub page: a basic analysis and slightly more advanced analysis. I'd encourage you to take a glance if you're interested in how this is done.
To start, some data cleanup was required. There were a few records that had null values in otherwise important fields, an outlier in the price field (a very large painting that would otherwise skew the analysis) and some of the fields needed to be converted to numeric data.
The data analysis was done with Python and the Pandas library. Plotting was done with Matplotlib and the Seaborn libraries.
Simon Bland: 21 Jan 2025